What Survives Outside Simulation
The race from The Races That Only Show Up at Full Occupancy needs more cycles than simulation can afford to reproduce reliably. The natural next move is to run the same firmware somewhere faster: emulation first, where cycle counts that would take a simulation farm days take an emulator hours, and eventually real silicon, where there’s no cycle budget at all because nothing is being simulated anymore.
Both moves ask the same question: which checkers survive the jump? Both times, the memory monitor from A UVM Monitor That Decodes C, and What It’s Worth doesn’t come along for free. Emulation and silicon break it in different ways and for different reasons, which is why they’re two halves of one article.
Emulation: why the testbench can’t just come along
Emulation hardware runs synthesizable logic. That’s the entire value proposition, a design running at hardware speed instead of being interpreted by a simulator, and it’s also the entire constraint: anything that isn’t synthesizable doesn’t run on the emulator at all.
The UVM memory monitor is built out of exactly the constructs that don’t synthesize: associative arrays keyed by a 32-bit identifier, queues of collected argument words, $sformatf, class-based c_msg_t objects. That isn’t a flaw in this monitor. UVM itself is a simulation-time software layer, not a hardware description, and the same is true of every scoreboard, predictor, and anything else built on uvm_component. None of it was ever going to run inside the emulated design.
So the porting question is never “make the monitor synthesizable.” It’s “what has to move into hardware to get the same signal out, and what can stay exactly as it is?” Emulation flows answer that the same way every time, by splitting the testbench in two:
- The untimed half, sequences, scoreboards, reference models, anything built from classes, stays on a host workstation and keeps running in a simulator exactly as before.
- The timed half, the drivers and monitors that wiggle and sample pins every clock, gets rewritten as synthesizable bus-functional models (BFMs) and compiled into the emulator next to the design.
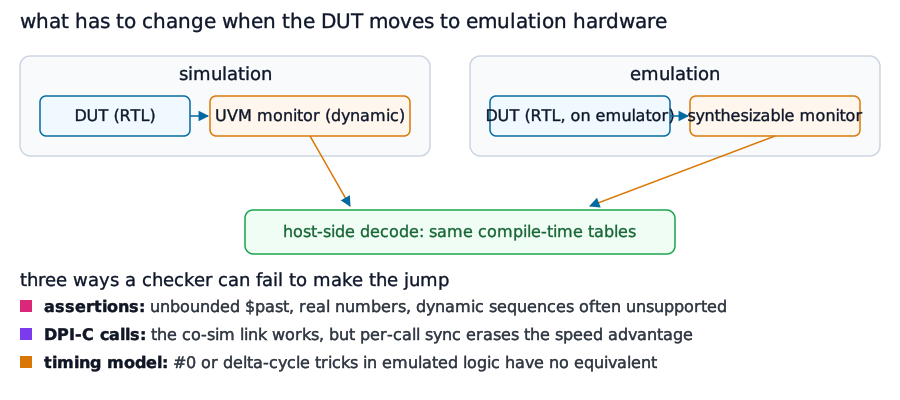
The two halves exchange whole transactions over a host link instead of individual signal values. What breaks on emulation is checker logic that has to cross from the first half into the second, or that talks across the link far more often than it should. That happens in three distinct ways.
Assertions. Immediate assertions and a useful subset of concurrent SVA do synthesize on most emulation platforms, through vendor assertion-synthesis flows built for exactly this. The support has edges, though: unbounded or very deep $past history, real-number operands, and dynamic sequence constructs are commonly unsupported, or translated with reduced fidelity, depending on the platform. An assertion set that compiles cleanly in RTL sim says nothing about whether it synthesizes, and few projects run a lint that would. The assertions that don’t make it either fail the emulation build or, worse, get dropped without an error. A dropped assertion is much harder to notice than a compile failure, because the run passes only because the check isn’t there.
DPI-C calls. DPI is how most reference models and scoreboards call into a C golden model, and the major emulation platforms support it, usually as the very transport the split testbench uses to cross the host link. It works. But every call is a synchronization point between the emulator running at hardware speed and the host running at software speed, so a reference model called on every transaction turns “hardware speed” back into “software speed plus overhead.” A DPI-heavy scoreboard doesn’t fail on emulation. It runs, and quietly erases the reason anyone moved to emulation, which nobody notices until someone asks why the emulator isn’t actually faster.
Timing-model assumptions. These are the subtlest, because they hide in code that never mentions timing. RTL simulation has delta cycles: within one simulated time step, a signal update and everything reacting to it settle through an ordered sequence of zero-time iterations before time is allowed to advance. The host half of a split testbench keeps those semantics, since it’s still running in a simulator. The emulated half doesn’t: the emulator evaluates the design and its BFMs cycle by cycle against real clock edges, with no general equivalent of a delta cycle. Any monitor logic that moves onto the emulator and depends, even accidentally, on delta-cycle ordering has no direct translation, whether that’s a #0 to let a signal settle before sampling it or a wait keyed to “after this update but before the next clock.” It needs re-deriving against what the emulator’s clocking model actually guarantees, not a search-and-replace of the timing construct.
The message-ID scheme survives this jump almost intact, and the reason is worth being specific about. At its core it’s a fixed-size store to a memory location, watched by something that reacts to writes, and nothing in that description needs a dynamic UVM construct. Only the watcher changes: instead of a uvm_component monitor doing table lookups inline, the emulator gets a small synthesizable bus monitor that recognizes writes to the PRINT_REG range and ships the raw identifier and argument words to the host as transactions, over the same link the rest of the split testbench uses. Decoding stays exactly where it was, on the host, against the same compile-time tables from Turning a Debug Message Into 32 Bits. The watching moved. Nothing else did.
Post-silicon: debugging with no probe access
The same race survives to silicon often enough that it eventually shows up on a bring-up board, after days of stress traffic no simulation farm or emulator could afford to run. There’s no waveform. There’s no internal visibility beyond what the design deliberately exposed: architectural registers, a JTAG debug port, maybe a trace port with a narrow, fixed bandwidth budget.
This isn’t a harsher version of emulation’s problem, it’s a different one. Emulation still runs the RTL, so a checker can watch an internal signal as long as that signal is wired to something observable. Silicon has committed to exactly the debug surface designed in at sign-off. Any checker whose job was comparing against internal state, a scoreboard diffing an internal buffer, an assertion on an internal FSM, has nothing left to attach to.
What does survive is anything whose signal was always architectural: a value written to a real memory location or register, readable by anything with access to the memory map, whether that’s a debug port, a boot ROM readout routine, or firmware relaying a summary over a production interface. The message-ID scheme from Turning a Debug Message Into 32 Bits and A UVM Monitor That Decodes C, and What It’s Worth was built entirely out of that kind of signal. That’s why it’s one of the few pieces of sim-side debug methodology that reaches silicon without a redesign. It still needs one assumption checked and two adjustments made.
The assumption: PRINT_REG is real memory
In simulation it doesn’t have to be. All the monitor needs is a bus write to watch, so the window is often a testbench memory model or a dummy slave that exists only in the sim build. On silicon that slave is gone, and a write to its address either errors or goes nowhere. Three conditions have to hold before the scheme works on a board:
- The window sits in real SRAM.
- That SRAM is mapped non-cacheable. Otherwise the last few messages before a crash, exactly the ones that matter, can still be sitting dirty in a write-back cache when the debug port reads memory and sees the stale contents underneath.
- If the crash ends in a watchdog reset, the boot ROM doesn’t zero that region on the way back up, or the readout finds an empty ring.
Adjustment one: a ring instead of a window
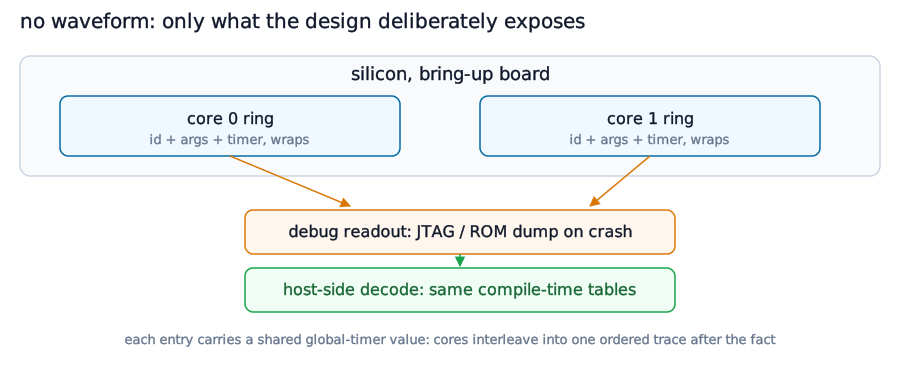
The sim and emulation versions used one PRINT_REG window per core, because something was always watching in real time. On silicon, nothing may be watching at all until a hang has already been noticed and someone attaches a debug port. So instead of one message-sized window per core, reserve a small ring of them, enough for the last handful of messages, and let firmware keep writing into it, wrapping around, whether or not anything is reading.
Each slot is a fixed size, big enough for the largest message (an identifier and up to three arguments) plus one timestamp word at a fixed offset:
 1/* Illustrative: the c_msg_4 from earlier in this series, writing into a
 2 * per-core ring instead of one fixed window. */
 3void c_msg_4(uint32_t unique_id, uint32_t a1, uint32_t a2) {
 4  /* Full address of this core's next slot, already wrapped; replaces the
 5   * PRINT_REG + 100 * HART_ID window from earlier in this series. */
 6  uint32_t slot = ring_next_slot(HART_ID);
 7  WRITE32(slot,        unique_id);
 8  WRITE32(slot + 0x4,  a1);
 9  WRITE32(slot + 0x8,  a2);
10  WRITE32(slot + 0x10, read_global_timer());
11  /* Written last, so a reader never mistakes a half-written slot for the newest. */
12  WRITE32(RING_HEAD(HART_ID), slot);
13}
After a hang or crash, whatever debug access exists, JTAG, a boot ROM dump routine, a maintenance command over a production UART, reads the region out once. The reader starts at each core’s RING_HEAD to find the newest entry and walks backward from there, and the same host-side tables from Turning a Debug Message Into 32 Bits decode it into a readable trace. Nobody had to be watching when the race actually happened.
Adjustment two: a shared timestamp
In simulation, “which core logged first” had an answer for free, because everything shares one simulated time axis. A host reading memory out after a crash has no such thing, only whatever timer hardware the design already has. That’s what the timestamp word is for: the current value of a free-running timer every core reads the same way, mtime on RISC-V or the generic timer on Arm. It has to be free-running, not a watchdog, because a watchdog’s count is reset every time firmware services it and says nothing about order across cores. It sits at a fixed offset in the slot rather than going in as an extra argument, so the argument count already packed into the identifier stays correct.
With that word in place, two cores’ rings, read out separately after a crash, merge into one trace ordered across both cores, even though nothing was watching either of them when the messages were written.
What to take from this
The useful lesson isn’t any one porting technique. It’s that whether a checker survives a platform change was decided when the checker was designed, by what it reads.
A checker that reads internal design state is tied to the platform that exposes it. It gets slower on emulation, where every internal signal it watches has to be wired out through the probe path and shipped across the host link, and it dies on silicon, where no porting effort helps because the signal is gone. A checker that reads architectural state, a value at an address plus a table built at compile time, works on every platform where that address and that build artifact exist. The message-ID scheme reached silicon with a ring, a timestamp, and three conditions on its memory, not a redesign, because it was built on the second kind from the start.
So the time to ask “will this survive emulation, or a bring-up board?” is when the checker is written, not when the race finally needs more cycles than simulation can give. If the answer is no, that’s fine for plenty of checkers. It just shouldn’t be a surprise. For the debug path, the one thing you need on every platform the bug might reach, build it on architectural state.
Next: Bridging the Register Map Chasm — the same “what survives the jump” question, asked about integration level instead of execution platform.