Querying Your Testbench
The articles so far have focused on automated, daemon-triggered analysis, things the system does continuously in the background. This one is about the interactive side: what a verification engineer can ask once the graph is live and the tools are built. These are answers that would otherwise take a new engineer two weeks to assemble by hand, and coverage gaps nobody has noticed because the question was never cheap enough to ask before.
What queries look like
A few examples, from simple lookups to multi-hop reasoning:
“Which UVM agents have no associated covergroup?” A straightforward graph query: find every UVM_AGENT node with no COVERS edge. Milliseconds.
“Which interfaces are monitored by more than one agent?” Find every INTERFACE node with multiple incoming MONITORS edges. Useful for spotting redundant monitoring, or a missing isolation boundary.
“Which tests exercise the error injection sequences?” Traverse UVM_TEST → SEQUENCES_VIA → UVM_SEQUENCE, filtered by name pattern or annotation. Produces a precise list without anyone reading a testplan document.
“Which modules in the DUT are exercised by no test at all?” Find MODULE nodes with no path from any UVM_TEST node through the DRIVES/INSTANTIATES graph. Either dead code, or an IP block that’s genuinely under-covered.
“What changed between last week’s regression and this week’s that could explain the coverage drop?” Diff the graph between two commits, find entities whose edges changed, correlate with the coverage delta.
Natural language query interface
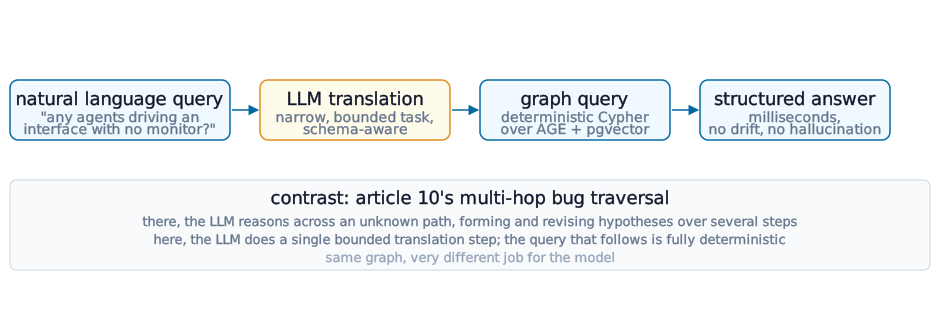
Most engineers aren’t going to write graph queries by hand. The interface is natural language, translated to a graph traversal by an LLM that knows the schema. “Are there any agents that drive an interface but have no corresponding monitor?” becomes a bounded graph query, executed, and the result returned. The LLM’s job here is narrow: translate a constrained domain question into a constrained query language, not reason about something open-ended. That’s a meaningfully different task from the bug-finding traversal in LLM Fleets for Code Traversal: there, the LLM is doing multi-step reasoning across an unknown path. Here, it’s a single, bounded translation step, and the graph query that follows is deterministic.
Coverage-guided exploration
A coverage report flags bin X in covergroup Y as uncovered. The graph already knows which module Y is associated with, which interface signal triggers the condition Y covers, which sequences exercise that interface, and which tests use those sequences. The path from “here’s an uncovered bin” to “here’s the sequence that would cover it” is a graph traversal, not a documentation search. In practice: an engineer sees the uncovered bin, queries the graph for associated sequences, finds the one structurally closest to what’s needed, and extends it, instead of guessing from a testplan that may not reflect what the testbench actually does anymore.
Onboarding acceleration
This is where the value shows up fastest. A new engineer joining a verification project typically spends weeks building a mental model of the testbench: which agents exist, which interfaces they drive, which sequences test which behaviors, how the scoreboards are wired together. The graph answers all of that in seconds. First day on a new DMA verification project looks like: “what agents exist in this environment?”, “which one drives the source-side interface?”, “what sequences does the source agent run, and which of those inject errors?”, “which scoreboard checks the destination side against the source?” Four queries, each answered immediately, cover ground that would otherwise mean grepping through the testbench, asking around, and reading a testplan document that may already be a version behind the code.
Keeping the graph current
None of this is useful if the graph doesn’t reflect the current state of the codebase. The git hook trigger model from The Orchestration Gap is what keeps it fresh: every commit re-indexes the files it touched, invalidates the edges those files affected, and propagates staleness where needed. In practice the graph lags a commit by seconds to a few minutes, depending on codebase size and how loaded the daemon is. When a query would touch a stale edge, the system surfaces that staleness explicitly to the user rather than quietly returning an answer that might no longer be true. A query interface that occasionally lies with confidence is worse than one that says “this part of the answer is 40 seconds old.”
Next: Local Deployment for DV Teams, packaging and deploying the full stack so the rest of the team can use it without touching the training infrastructure.