Your Debug Infrastructure Is Part of the Bug
The obvious next move after The Races That Only Show Up at Full Occupancy’s vulnerable ring_push() window is to add a debug print right around it on both the producer and consumer side, rerun the regression, and read off which core got there first. Do that, and one of two things happens: the failure rate drops, sometimes to zero, or the failure moves somewhere else entirely, one function further down, with a length mismatch on a different descriptor. Nothing about the race got fixed. The instrumentation changed the timing enough to move the bug, and the bug is right back the moment the prints come out. This is a specific, mechanical effect, not bad luck, and it’s worth understanding exactly why before reaching for a “better” logging setup that has the same property.
What a UART write actually costs
A typical firmware debug print is a loop that writes one character at a time to a UART transmit register, usually gated by a status bit that says the transmit FIFO has room. Every character is a register write followed by a poll or a wait. A short message might be 40-60 characters; at realistic simulated UART rates that’s tens of thousands of simulation cycles spent entirely inside the print call, cycles during which the core issuing the print isn’t doing anything resembling the workload the test is actually trying to exercise.
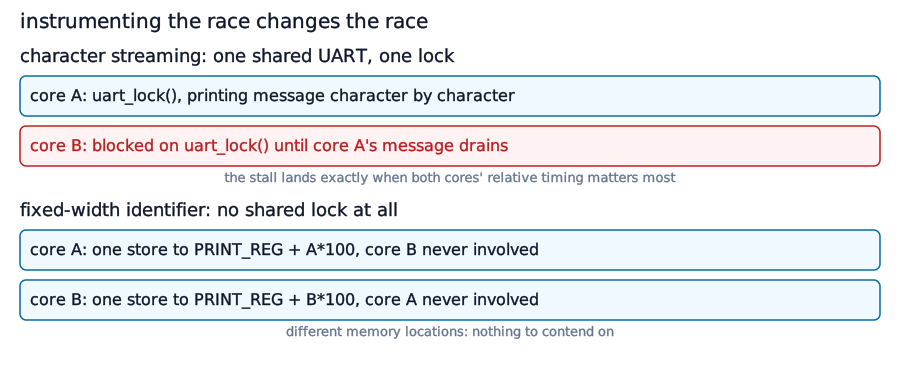
That cost alone would just make the test slower. The part that actually breaks the race is what happens when a second core needs to print at close to the same moment. A shared UART is a single peripheral, and firmware around it almost always serializes access with a lock, because two cores writing characters into the same transmit FIFO without coordination interleave into garbage on the wire. So the instant core A starts printing, core B’s print call (and, depending on how the lock is scoped, anything else on core B waiting behind it) blocks until core A’s entire message has drained. That is a synchronization stall inserted directly at the moment both cores are near the contended resource from The Races That Only Show Up at Full Occupancy, which is exactly the moment their relative arrival time determines whether the race window closes correctly or not. The print didn’t observe the race. It rescheduled it.
 1/* Illustrative: the print call itself becomes a synchronization point
 2 * between cores, at exactly the moment their timing relative to each
 3 * other is what the bug depends on. */
 4void debug_print(const char *msg) {
 5    uart_lock();                 /* core B stalls here if A is mid-print */
 6    for (const char *p = msg; *p; p++) {
 7        while (!uart_tx_ready()) /* poll, one character at a time */
 8            ;
 9        uart_tx_write(*p);
10    }
11    uart_unlock();
12}
This is a probe effect, and it’s worse under load
None of this is specific to UARTs, and none of it is specific to the core-to-core flavor of race either. The Same-Core Race’s ISR-versus-mainline race and When Hardware Sleeps but Firmware Is Awake’s power-transition race are both just as vulnerable to the same mechanism: any instrumentation that adds a serialization point, a shared log buffer with a spinlock, a semaphore-guarded ring, a single memory-mapped print register with no per-core isolation, has the same failure mode. The more logging is active, the more the act of logging itself becomes the dominant scheduling event in the system, displacing whatever timing the test was trying to observe. It gets worse exactly where it matters most, because the runs most likely to hit a rare race are the ones under the heaviest, most realistic load, which is also where contention on a shared logging resource is worst.
The instinct at this point is usually “make the UART faster” or “give each core its own UART.” A faster UART reduces the duration of the stall without removing it, so it shrinks the window in which the probe effect operates without eliminating the mechanism. A UART per core solves the serialization problem specifically but doesn’t exist on most real SoCs, since UART count is a hardware budget decision made long before anyone’s chasing a race, and adding one per core to make debug easier isn’t something silicon gets redone for.
Quantifying it, not just describing it
Independent of the race-perturbation problem, character streaming is simply slow at the volumes a real debug session needs, using a single shared memory-mapped print location, the best case, not the contended-UART worst case this article has been describing. Exactly how slow is worth measuring precisely rather than asserting, and a later article does that measurement in full once the fixed-width alternative below actually exists to compare against. The shape of the result is enough to motivate what comes next: streaming spends cycles proportional to message length, one write per character, the identifier scheme spends a small, fixed number of writes no matter how long the message would have been.
At single-test scale that difference is an annoyance. At regression scale, hundreds of tests each logging on the order of hundreds of messages while chasing exactly the kind of race The Races That Only Show Up at Full Occupancy describes, even a moderate per-message gap compounds into the difference between a debug session that finishes overnight and one that doesn’t finish before the next regression needs the same machines.
The actual requirement
What’s needed is a logging primitive that doesn’t force cross-core serialization to emit a message, and doesn’t spend cycles proportional to message length. Both of those point at the same fix: stop treating a debug message as a string of characters that has to physically move somewhere, and start treating it as a small, fixed-size piece of data, an identifier that can be looked up later, that a core can write in a single unsynchronized store to a location that belongs to it alone. That’s the mechanism the next two articles build.
Next: Turning a Debug Message Into 32 Bits — the identifier scheme and the macros that generate it.