A UVM Monitor That Decodes C, and What It's Worth
Article 05 got a 32-bit identifier and its arguments into fixed memory locations with one unsynchronized store per core, and a pair of tables generated at compile time that map identifiers back to the original message string and file/line. This article is the other half of that mechanism, adapted from the same technique presented at SNUG Silicon Valley 2025 (Shevade & Shripad, UVM_INFO From Firmware Code): a UVM memory monitor that watches the write locations, reconstructs the message, and prints it through uvm_info/uvm_error like any other testbench message, plus the actual performance case this whole series has been building toward.
Loading both tables into the testbench
Before the monitor can decode anything, both tables from article 05 need to be parsed into associative arrays indexed the same way the C side computed the identifier, so a lookup at runtime is a single hash access, not a scan:
 1typedef struct {
 2  int severity;
 3  string message;
 4  int nargs;
 5  int args_seen;
 6  bit [31:0] args[$];
 7} c_msg_t;
 8
 9typedef bit [31:0] unique_id_t;
10
11c_msg_t message_table[unique_id_t];
12unique_id_t current_uuid[NUM_CORES];
13string c_msg_id_table[int];
14
15function void read_message_table_file(string filename = "c_msg_table.txt");
16  c_msg_t entry;
17  string line, splits[$], msg_splits[$];
18  int fd;
19  if ((fd = $fopen(filename, "r")) != 0) begin
20    while ($fgets(line, fd) != 0) begin
21      // format: unique_id_hex, severity, arg_count, "message"
22      uvm_split_string(line, "\"", msg_splits);
23      uvm_split_string(msg_splits[0], ",", splits);
24      entry.severity  = splits[1].atoi();
25      entry.message   = msg_splits[1];
26      entry.nargs     = splits[2].atoi();
27      entry.args_seen = 0;
28      message_table[splits[0].atohex()] = entry;
29    end
30  end
31  $fclose(fd);
32endfunction
The file-ID table parses the same way, mapping each compiled source file to the small integer the Makefile assigned it, so a decoded message can report the actual file name, not just a number.
The monitor: one write, then the message is ready
The memory monitor watches each core’s designated PRINT_REG window. The first write to a core’s base address is always the identifier; if the decoded entry expects zero arguments, the message is printed immediately, otherwise the monitor tracks which core is mid-message and waits for the argument writes that follow at fixed offsets. T below is the memory transaction the monitor’s analysis port receives on every bus access, T.StartAddress and T.Data are whatever the passive bus/memory monitor already populates on that transaction object, this snippet is the write-side callback that runs against each one:
 1for (int i = 0; i < NUM_CORES; i++) begin
 2  if (T.StartAddress == `PRINT_REG + i*100) begin
 3    unique_id_t uuid = {T.Data[3], T.Data[2], T.Data[1], T.Data[0]};
 4    if (message_table[uuid].nargs == 0) begin
 5      print_uvm_message(uuid);
 6    end else begin
 7      current_uuid[i] = uuid;
 8    end
 9  end else if (T.StartAddress == (`PRINT_REG + i*100 + 'h4)) begin
10    bit [31:0] arg = {T.Data[3], T.Data[2], T.Data[1], T.Data[0]};
11    message_table[current_uuid[i]].args_seen += 1;
12    message_table[current_uuid[i]].args.push_back(arg);
13    if (message_table[current_uuid[i]].args_seen ==
14        message_table[current_uuid[i]].nargs)
15      print_uvm_message(current_uuid[i]);
16  end
17  // additional argument offsets (+0x8, ...) follow the same pattern
18end
print_uvm_message does the actual reconstruction: look up the table entry, $sformatf the stored format string against the collected argument words, and map the decoded severity onto the right UVM macro so it lands in the simulation log the same way any other testbench message would, with the firmware’s own file and line attached:
 1function void print_uvm_message(unique_id_t unique_id);
 2  c_msg_t entry;
 3  string preformatted_msg, message_header;
 4
 5  if (!message_table.exists(unique_id)) begin
 6    `uvm_warning("C_MSG", $sformatf("0x%08h not found in message_table", unique_id))
 7    return;
 8  end
 9  entry = message_table[unique_id];
10
11  message_header = decode_unique_id(unique_id); // file:line from c_msg_id_table
12
13  case (entry.nargs)
14    0: preformatted_msg = entry.message;
15    1: preformatted_msg = $sformatf(entry.message, entry.args[0]);
16    2: preformatted_msg = $sformatf(entry.message, entry.args[0], entry.args[1]);
17    default: preformatted_msg = $sformatf(
18      "<unsupported arg count %0d> %s", entry.nargs, entry.message);
19  endcase
20
21  case (entry.severity)
22    1: `uvm_error(message_header, $sformatf("unique_id=0x%08h: %s", unique_id, preformatted_msg))
23    2: `uvm_info(message_header, $sformatf("unique_id=0x%08h: %s", unique_id, preformatted_msg), UVM_LOW)
24  endcase
25endfunction
What shows up in the simulation log reads like ordinary firmware trace, not a hex dump that needs a separate decoder pass:
3300000: [[C_MSG][core_2]:: bare_bones.c,57] 0x42400039: Executing main for core_2
5736000: [[C_MSG][core_2]:: bare_bones.c,79] 0x4240004f: Core_2... DONE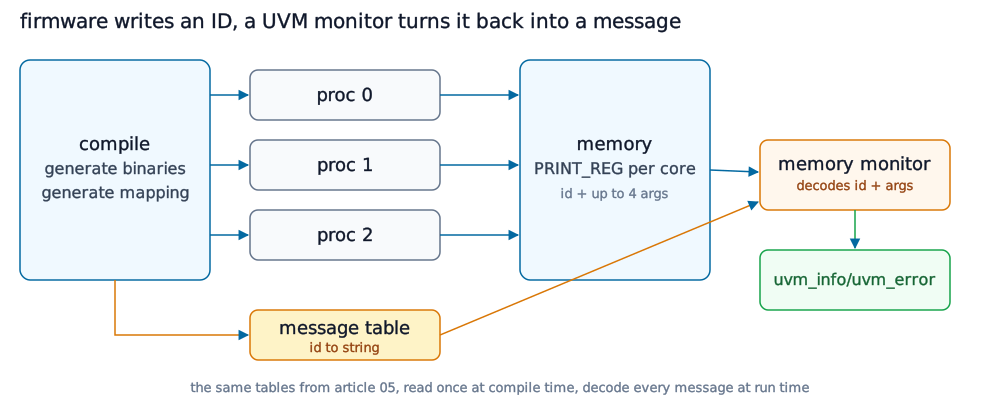
What this is actually worth
This is the measurement article 04 promised rather than gave: 100 messages, up to 64 characters each, logged through a shared memory-mapped location. Character streaming took 764.946us of simulation time and 23 minutes 39 seconds of wall clock. The message-ID scheme above took 72.074us and 6 minutes 36 seconds for the same 100 messages, a roughly 90% reduction in simulation time and a comparable drop in wall clock, though wall clock is noisier since it depends on whatever else is running on the same machine.
The mechanism behind that gap is exactly what this article and the last one built: streaming spends cycles proportional to message length, one write (and one FIFO-ready poll) per character; the identifier scheme spends a fixed, small number of writes regardless of message length, one word for the identifier and one per argument, at most three total for a two-argument message. That difference doesn’t depend on multi-core contention at all, it holds even measured on a single core with no cross-core lock in the picture. Add the cross-core serialization problem from article 04 back in, and the gap widens further, because the identifier scheme has no shared lock to contend on in the first place: each core writes to its own PRINT_REG offset, so nothing about emitting a message forces one core to wait on another’s.
At the scale of a single test this is a nice speedup. At regression scale, with the kind of heavy, always-on logging that chasing a rare multi-core race actually requires, it’s the difference between debug instrumentation that’s cheap enough to leave on for every run and one that has to be switched on selectively after a failure is already suspected, which puts the entire methodology back to reproducing the bug first and instrumenting it second.
Next: The Dual-Sided Register Backdoor — firmware writes a register directly and RAL’s mirror goes stale; a UVM backdoor write goes stale the other way. DPI doesn’t answer either one.